


Today we are happy to introduce Orus, a platform for better onchain analytics.
Orus is the little crypto brother of the Bloomberg terminal (equally smart but better looking).
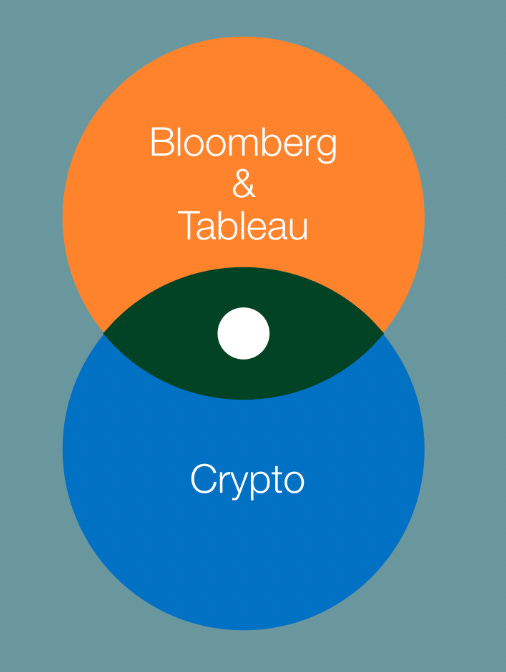
As the crypto industry matures, blockchain analytics will become more and more important. AI systems are getting smarter and smarter, but before they can be used, modular and contextualised data is needed.
This is exactly what we are doing at Orus.
We believe that the analytics side of the industry can be improved in many ways:
Why we built Orus?
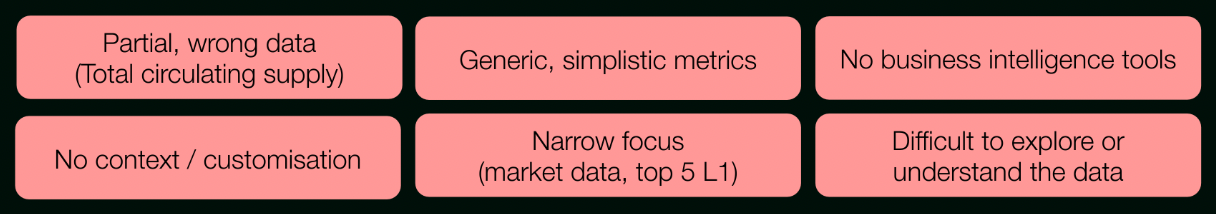
Making data driven decisions in the crypto industry is hard. Data is not available in a single place, it’s expensive and often not usable as is, but requires additional processing to make it usable.
Exploratory data analysis is especially hard, having to switch between different platforms and dashboards, or building custom solutions to satisfy your use cases.
While building custom solutions can be a valid approach, not everyone needs to do it or has the resources to do it.
That’s where Orus comes to play.
Orus is designed to be your single store of data.
Why orus is unique?
We bring context to the raw onchain data
We translate it into a format that is easily digested by the audience
We flexible and modular interfaces to build your dashboards
Data
Onchain Data is open and publicly available, but often difficult to understand. It is not contextualised, which makes using it much harder because of the need to build additional layers on top of it.
Orus aims to be the layer between raw data and your analytics processes.
Orus collects raw onchain data and contextualises the data points, aggregates them, creates custom metrics and much more.
What you can find in Orus is unique, from simple standard metrics:
Number of transactions
Average block reward
Distribution of tokens and number of holders
Liquidity of pools
TVLs and liquidity
…
to very specific custom metrics:
Capital efficiency
Trading velocity
NVT
Average revenue per user
Deposit withdrawal ratio
…
We want to improve decision making by making data your friend, not your enemy. Remember, the success of our industry, depends on the quality of our decisions.
For a complete list of metrics, visit our gitbook page, but remember, there’s plenty more to come.
Interfaces
We want to introduce Bloomberg’s modularity and customisability to the crypto scene, but improve the interfaces.
Imagine if all you had to type to get the TVL of Ethereum, Polygon, Arbitrum and Optimism is:
[ETH, POLYGON, ARB, OPT]C TVL G 180D 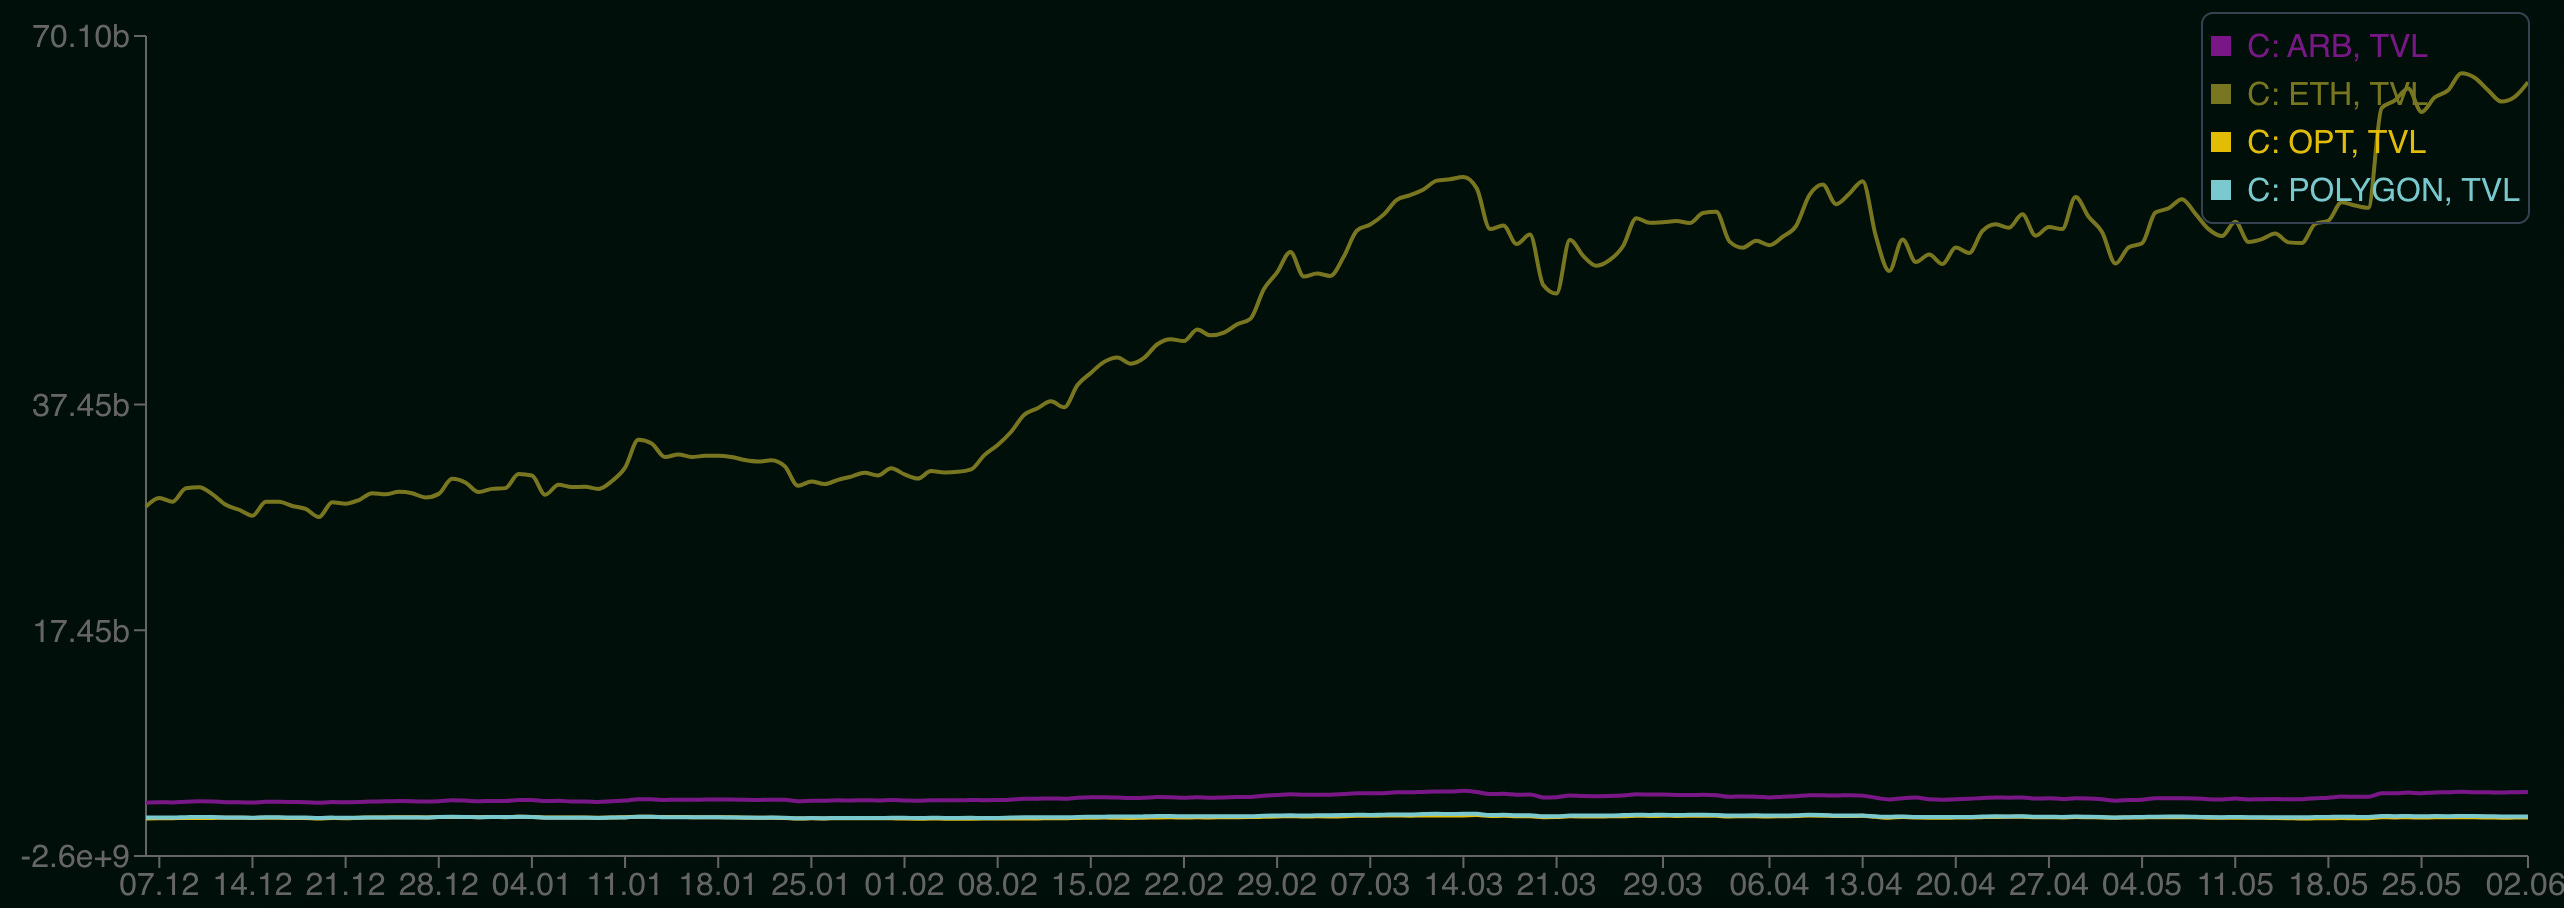
Or to get transaction count of all stable coins on Ethereum is:
[ETH]C [STB]SEC TXC G 180D 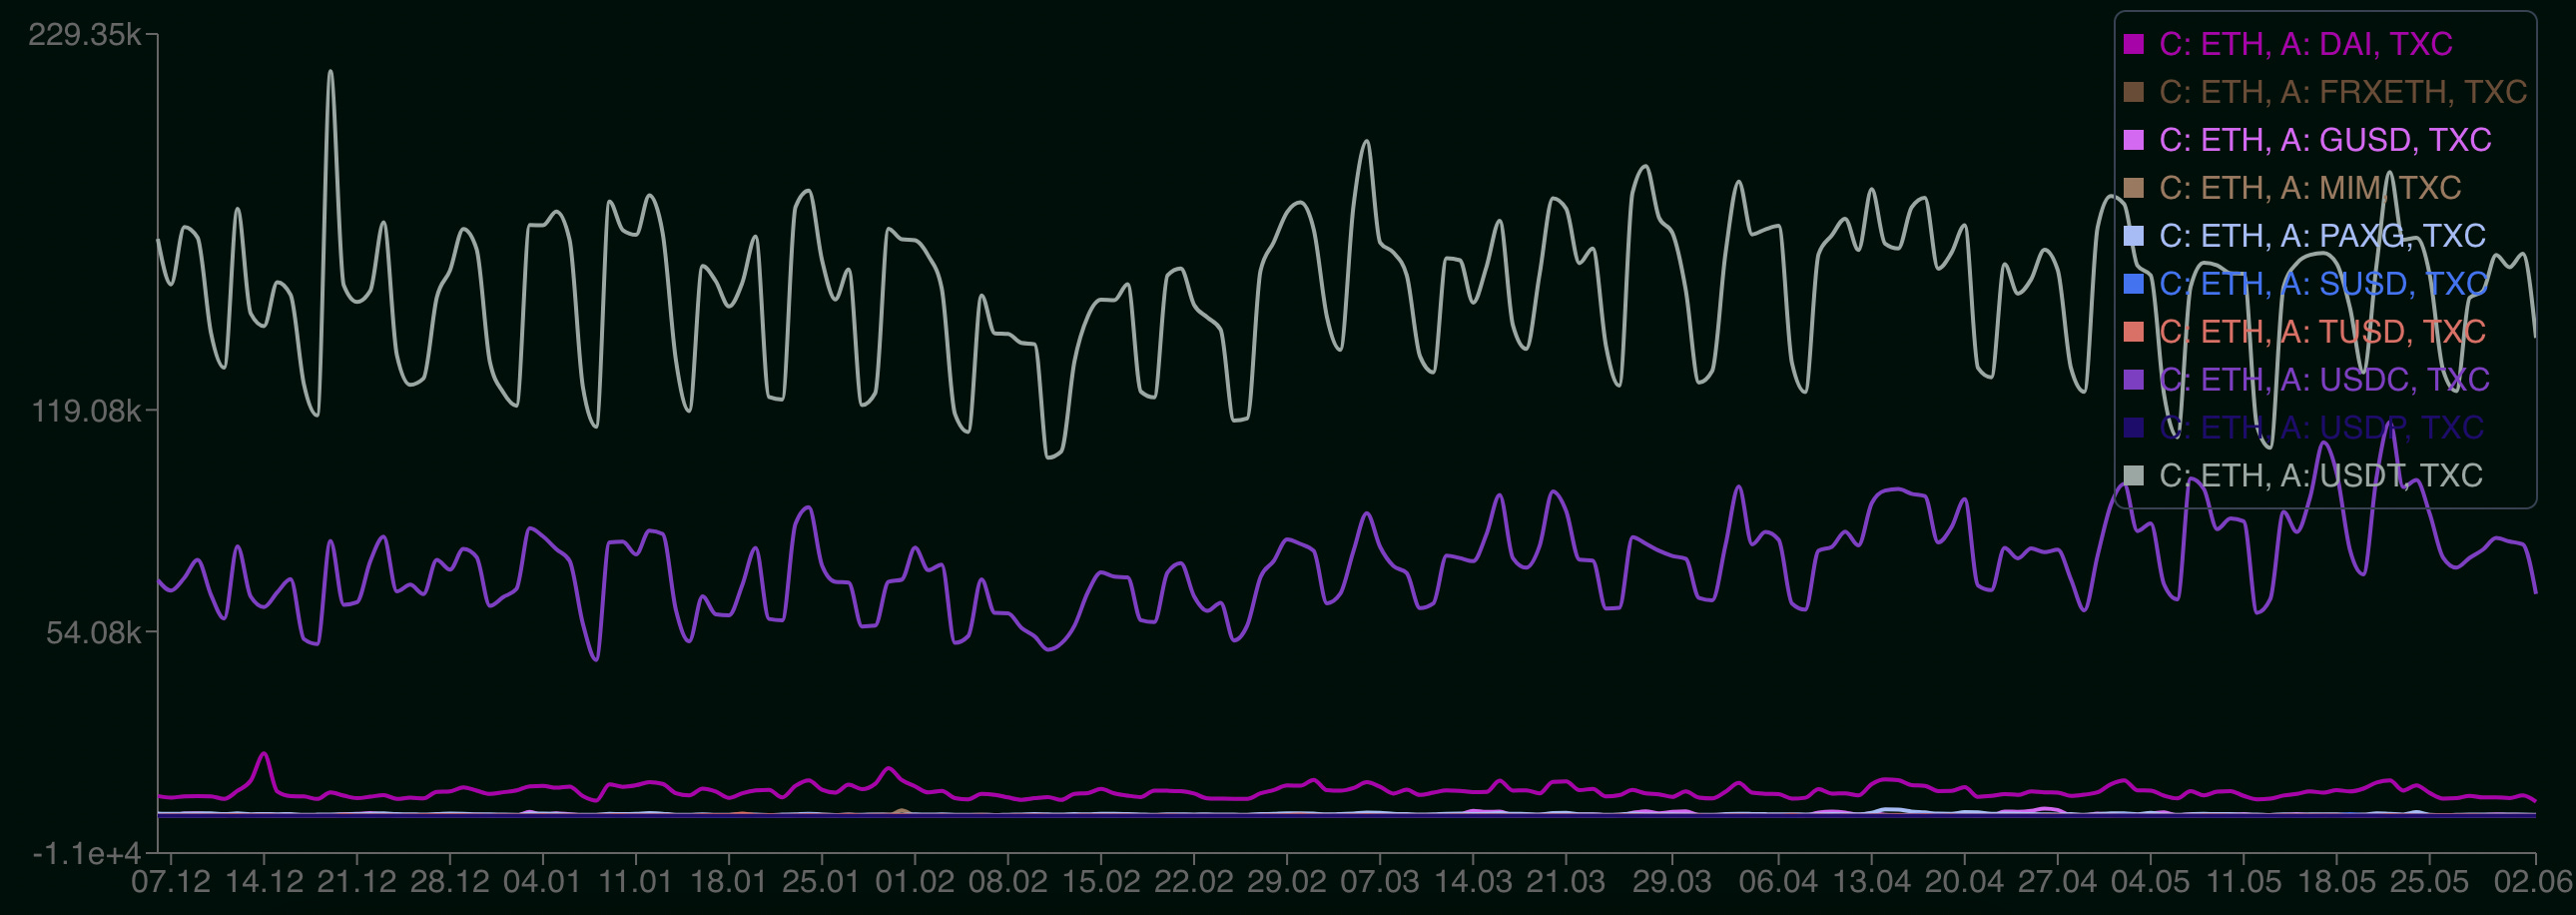
Or to get the lending borrowing spread of USDC, USDT, and DAI on all lending pools on Compound and Aave on Ethereum chain is the following:
[ETH]C [AAVE*, COMPOUND*]APP [USDC, USDT, DAI]A BRS G 180D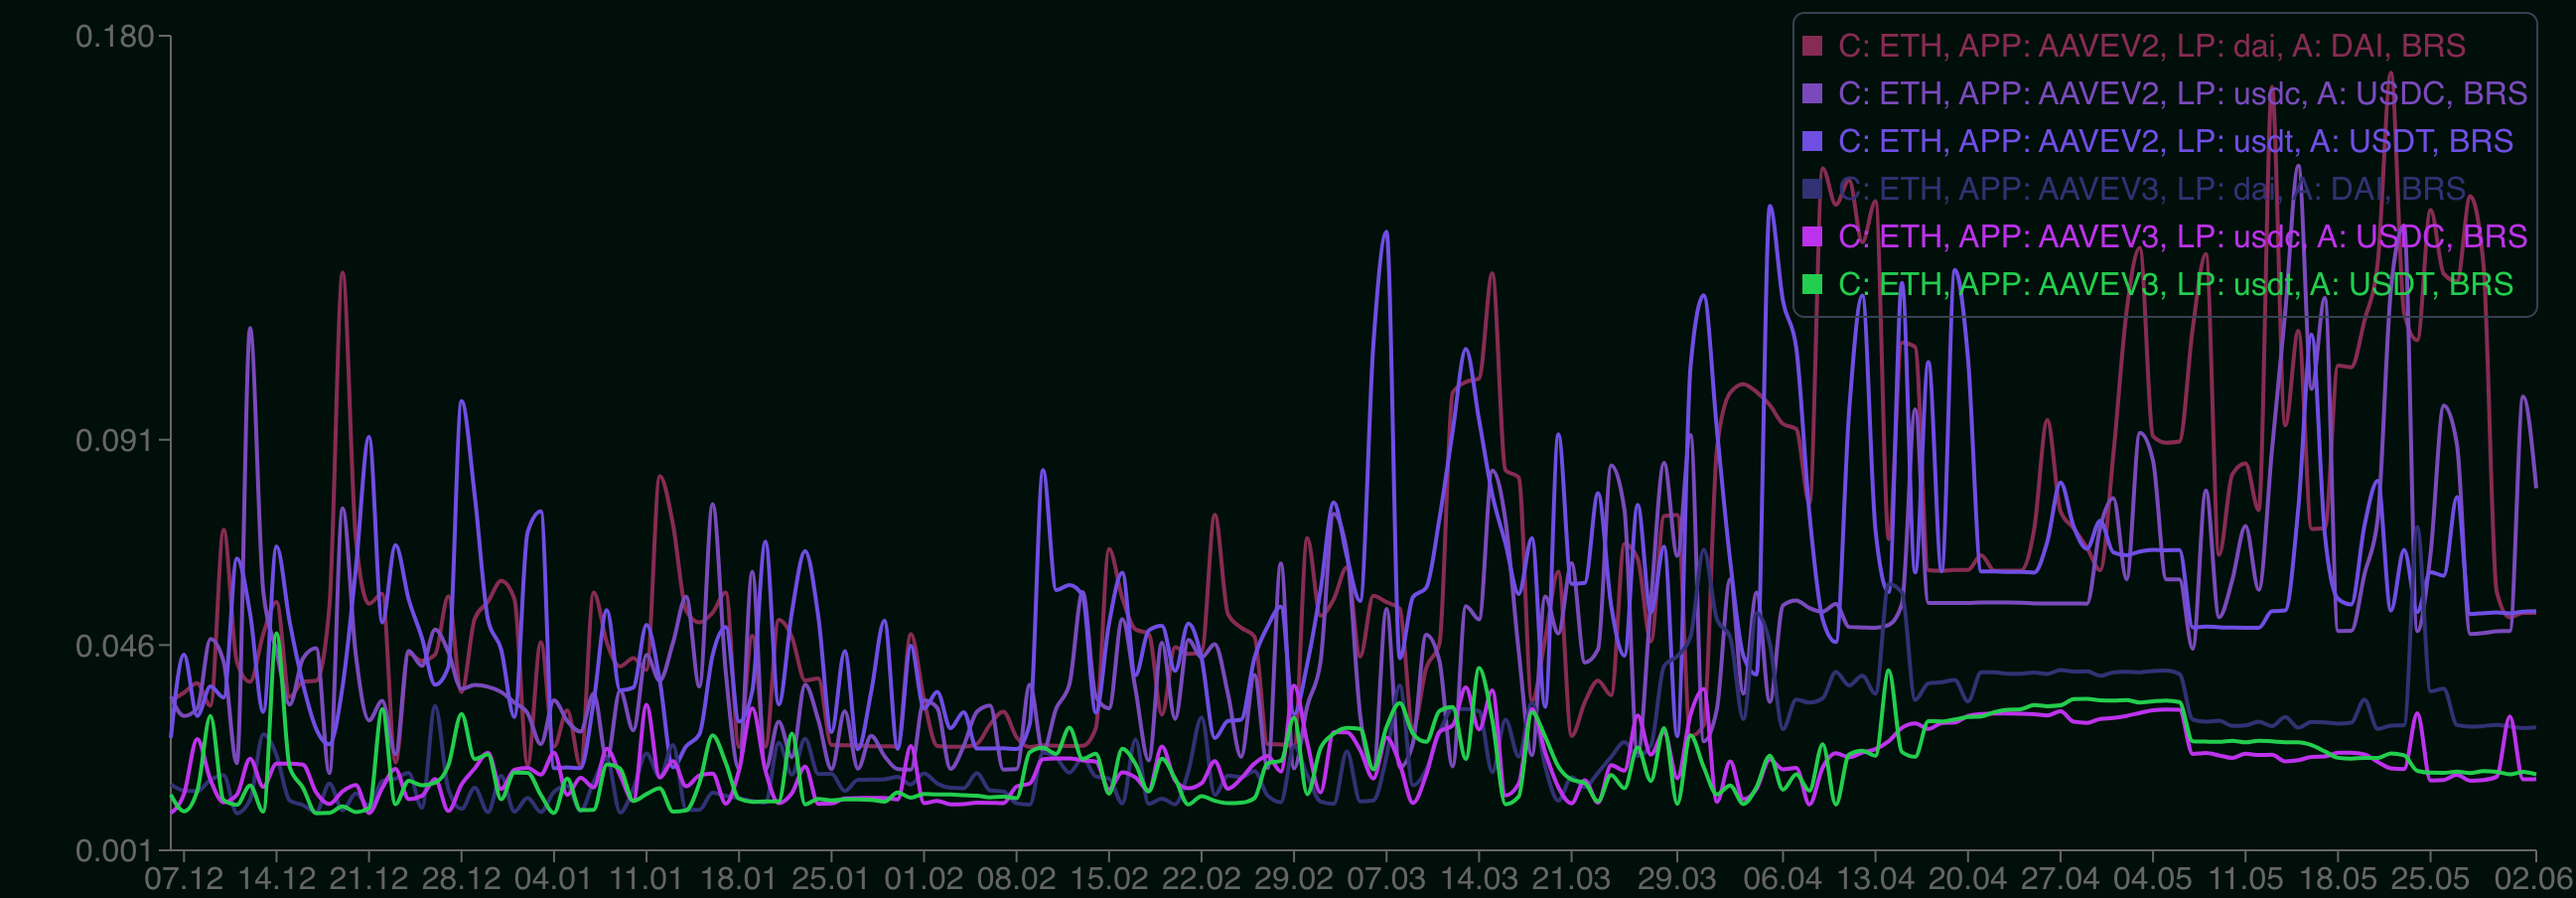
We have designed a custom DSL that makes generating charts much faster and more flexible compared to clicks.
Don’t worry about the syntax too much, the DSL is made to make your life easier and will be explained in detail in the following post.
Ready to dive into data? Schedule a demo call with us!
We are just starting with Orus, any feedback, comments or questions are welcome!